Data Visualisation
Combined Land-Surface Air and Sea-Surface Water Temperature Anomalies
(Land-Ocean Temperature Index, LOTI)
Zonal annual means.
Map image source: https://commons.wikimedia.org/wiki/File%3AWorld_map_blank_without_borders.svg
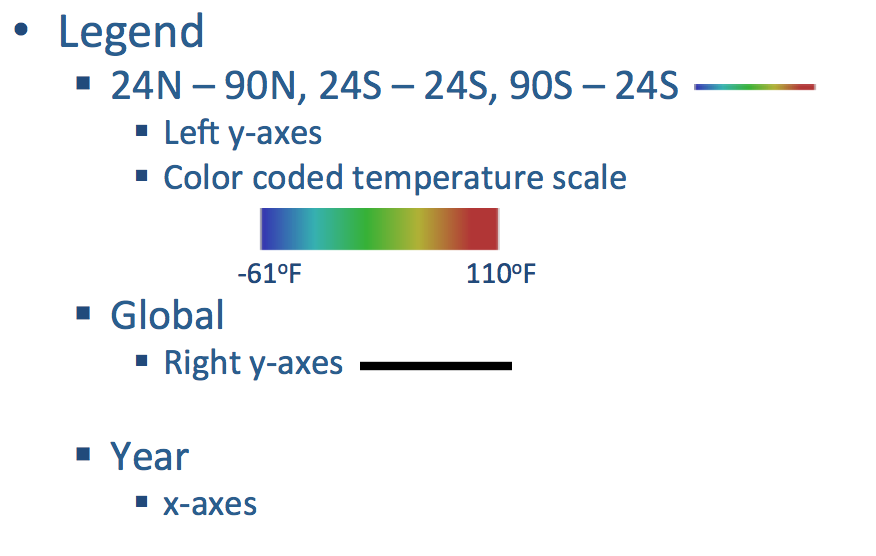
The subset of data used are "Year", "Glob", "24N-90N", "24S-24N" and "90S-24S".
The y-axes represent the year from 1880 to 2014.
The left x-axes are divided into 3 sections, that represent the latitude "24N-90N", "24S-24N" and "90S-24S" on the map.
The right x-axes represent the "Glob"
When you move the mouse from left to right, four graphs will be plotted with the constant update of current year temperature.
The three colour coded graphs are for "24N-90N", "24S-24N" and "90S-24S".
The black line graph is for "Glob".
The graph shows that the global zonal annual means:
- From year 1880 to 1935, stays within a range of -47℉ to -8℉.
- From year 1936 to 1950, there is a sharp spike from -14℉ to 26℉ and to -18℉.
- From year 1951 to 1977, it comes back down and stay within a range of -20℉ to 18℉.
- But from year 1978 onwards, it keeps on increasing every year with an average of 0.5℉/year.